Best in Class Data to Monitor the World's Land
Land & Carbon Lab is partnering with leading scientists and technologists to build a comprehensive monitoring system for the world’s land and its nature-based carbon. Our high-resolution geospatial data will help decision-makers everywhere address the global land squeeze and accelerate nature-based solutions to climate change.
Read more about what we’re building or explore the preliminary data below.
-

Land Cover
-

Forests
-
Agriculture
-

Carbon
Land Cover
Global Land Cover Change
20 years of land cover data reveals important transformations of our planet — Learn more.
Land & Carbon Lab partnered with the Global Land Analysis & Discovery (GLAD) lab at University of Maryland to produce the first ever high-resolution map of global land cover change over the last 20 years. The map distinguishes eight general land cover classes: Forest, Cropland, Built-Up Area, Water, Bare Ground, Short Vegetation, Snow/Ice, and Wetlands. Data can be visualized and downloaded on Resource Watch.
Geographic coverage: Global
Resolution: 30x30 meters
Temporal coverage: 2000-2020
Data Partner: University of Maryland
Dynamic World
Dynamic World is a near-real-time global 10-meter land use/land cover mapping dataset created by Google and the World Resources Institute by using deep learning artificial intelligence methods and large training datasets. The dataset covers nine land cover classes and is based on Sentinel-2 10-meter resolution data. This high-resolution data helps us better understand seasonal and intra-annual land cover changes. The dataset is updated every few seconds with each new Sentinel-2 scene, and can be visualized on Resource Watch and accessed in Google Earth Engine.
Geographic coverage: Global
Resolution: 10x10 meters
Temporal coverage: 2016-present
Data Partner: Google, World Resources Institute

Monthly land cover over the Okavango Delta
OPERA Land Surface Disturbance Product (DIST-ALERT)
A groundbreaking new land surface disturbance monitoring system developed by NASA’s OPERA project and the University of Maryland detects disturbances to any kind of vegetation cover, including forests, grasses, shrubs and even crops, occurring anywhere on Earth in near real-time — Learn more.
Using harmonized data from the NASA/USGS Landsat and ESA Sentinel-2 satellites, the new system, known as OPERA Land Surface Disturbance Alert from Harmonized Landsat Sentinel-2, or DIST-ALERT, can identify and continuously monitor vegetation in 30-m pixels across the globe.
This new system will fuel future alert products that Land & Carbon Lab and the University of Maryland will develop for many possible applications, such as tracking agricultural expansion through the conversion of natural lands, detecting degradation dynamics such as logging, and monitoring short-lived vegetation changes such as from drought and fire.
Geographic coverage: Global
Resolution: 30x30 meters
Temporal coverage: Sub-weekly
Data Producer: NASA's Jet Propulsion Laboratory (JPL) and the University of Maryland
Funding: The OPERA project is funded by NASA to address remote sensing needs identified under the Satellite Needs Working Group.
Forests
Tropical Tree Cover
Higher-res data set now shows trees inside and outside forests across the tropics — Learn more.
Tropical Tree Cover maps trees inside and outside of dense forests using 10-meter global imagery from Sentinel-2. This higher-resolution tree cover data improves our ability to quantify tree cover on non-forest lands, such as urban areas and cropland, and monitor trees at small spatial scales. Trees in these landscapes collectively store vast amounts of carbon and restoration in these areas can have massive social and economic impact. Data can be visualized, analyzed, and downloaded on Global Forest Watch.
Geographic coverage: Tropics
Resolution: 10x10 meters
Temporal coverage: 2020
Data Partner: World Resources Institute
Agriculture
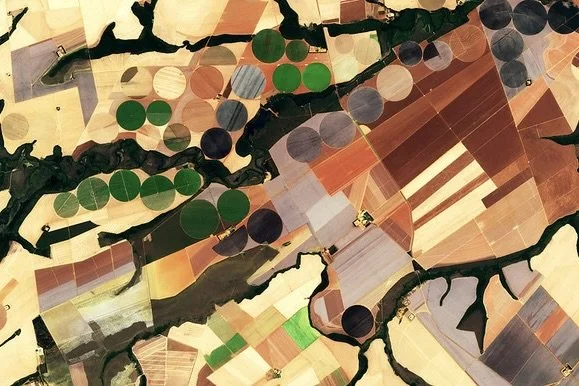
Global Cropland Change
Geographic coverage: Global
Resolution: 30x30 meters
Temporal coverage: 2000-2019
Data Partner: University of Maryland
The Global Land Analysis & Discovery (GLAD) Lab at University of Maryland produced the first global map of cropland extent and change at 30-meter resolution for 2000 through 2019. The cropland extent maps are available for five epochs (2000-2003, 2004-2007, 2008-2011, 2012-2015, and 2016-2019), as well as net change between the first and last epochs. Data can be visualized and downloaded from Resource Watch.
Global Pasture Watch
COMING SOON: A new research consortium will map and monitor the changing extent, management intensity, productivity, and health of global grasslands.

Pastures and rangelands are the single most extensive land use on Earth and we need to understand the productivity of these areas and how they are changing over time to meet global climate goals. Yet these areas rarely have dedicated monitoring efforts and there is currently no good understanding of the their location, area, and condition.
A new Land & Carbon Lab research consortium will aim to produce recurrent and high-resolution (30-meter) maps for pasture areas and productivity from 2000 onwards. The project uses ensemble machine learning algorithms, visual interpretations, crowdsourcing, and earth observation data fusion to produce per-pixel probabilities of land use and land cover, livestock density, short vegetation height, and gross primary productivity (GPP). The resulting products will contribute to better understanding land use conversion, food production, land productivity, and impacts for biodiversity and climate change at a global scale.
Geographic coverage: Global
Resolution: 30x30 meters
Temporal coverage: 2000-2020
Data Partners: OpenGeoHub, LAPIG, IIASA, World Resources Institute
Status: Under development
Spatial Production Allocation Model (SPAM)
New data shows where, and how much, crops are produced around the world.
The International Food Policy Research Institute’s Spatial Production Allocation Model (SPAM) provides globally consistent maps of crop areas and yields that are pivotal for understanding how crop types and their production vary both within and between countries.
Initially introduced in 2008, this innovative product has since undergone multiple updates. The latest version, developed with support from Land & Carbon Lab, features data from 2020 and represents a significant leap forward. It encompasses global maps of crop areas and yields for 46 crops and crop groups, mapped at a 10-kilometer resolution.
The result is globally consistent data that provides critical information for understanding drivers of deforestation and conversion of natural lands, crop-related emissions, water use and agricultural production worldwide to help achieve sustainable supply chains and food security.
Geographic coverage: Global
Resolution: 10-kilometers
Temporal coverage: 2000, 2005, 2010, 2020
Data Partner: The International Food Policy Research Institute (IFPRI)
Carbon
Forest Carbon Fluxes
New data shows that between 2001 and 2020, the net carbon removal provided by forests was equivalent to removing approximately 1.2 times the annual GHG emissions from the United States — Learn more.
Forest Carbon Flux data quantifies emissions, removals, and net carbon fluxes consistently over any area of forest land. This data enables users to view forest-related carbon dynamics at any scale, providing a detailed understanding of how various forested areas are contributing to global emissions and removals. This data will be updated annually, and we aim to expand this dataset to include all land-related carbon emissions and removals.
Geographic coverage: Global
Resolution: 30x30 meters
Temporal coverage: 2000-2020
Data Partner: World Resources Institute
Global Forest Carbon Removals
COMING SOON: A new research consortium will map the current and future forest carbon sink under different climate change scenarios.

Forest ecosystems are a key component of the global carbon cycle, removing approximately 30% of anthropogenic carbon emissions every year. Managing forests has immense potential for climate change mitigation, but requires precise knowledge about where and how quickly forests are removing carbon from the atmosphere over time. Due to inconsistent data, methods and assumptions in existing global forest carbon monitoring systems, little is currently known about the location or future direction of the global forest carbon sink. Furthermore, biodiversity, timber quality and other forest ecosystem services are undergoing substantial changes, yet little has been done to incorporate these changes into the projection, management and conservation of forest resources.
A new Land & Carbon Lab research consortium will map global forest stand dynamics and carbon removals using state-of-the-art models combining detailed ground measurements from more than 1.2 million inventory plots worldwide with remote sensing data and machine learning algorithms. The project will generate global maps of past, present and future carbon removals in the world’s forests annually from the year 2000 through the year 2070 under different climate change scenarios. Results can be used by various actors developing nature-based solutions to monitor impacts of current and future forest management practices and explore tradeoffs between different ecological and economic objectives, benefiting forest management decision-making worldwide.
Geographic coverage: Global
Resolution: 1x1 kilometers
Temporal coverage: 2000-2070
Data Partner: Purdue University
Status: Under development
Thumbnail photo credit: Neil Palmer/CIAT