New Data Shows Where, and How Much, Crops are Produced Around the World
By Elise Mazur, Fred Stolle, Lucia Fitts, Liz Saccoccia and Liangzhi You (IFPRI)
As the global population grows to a projected 9.8 billion people in 2050, overall demand for food is on course to increase by more than half. The crops these lands produce are essential for communities around the globe, who use them for both direct food as well as for other uses like animal feed, seeds, industrial processing and exports. But this increasing demand means that 102 million hectares of land — an area the size of Egypt — has been converted to crops since the start of the 21st century, often at the expense of forests, wetlands and other natural ecosystems. Field crops, like maize and wheat, already cover 1.2 billion hectares of land, approximately 12% of Earth’s surface, and tree crops, like timber and oil palm, cover an additional 64 million hectares. Crops use over 70% of water withdrawals from surface and groundwater, and expanding croplands contributes to greenhouse gas emissions and can be a major driver of biodiversity decline.
To sustain a growing population without further expanding croplands into vital natural ecosystems and straining water resources, we need to develop more efficient crop systems that produce more crops on less land with less water.
A vital step in solving this challenge is understanding how crop production and yields are distributed around the world. To do this, the International Food Policy Research Institute (IFPRI) with support from Land & Carbon Lab developed an updated Spatial Production Allocation Model (SPAM) to produce globally consistent maps of crop areas and yields that are pivotal for understanding how crop types and their production vary both within and between countries.
This information is critical for developing sustainable supply chains and will be applied in various monitoring tools and regulations that aim to support companies, such as the Greenhouse Gas Protocol Land Sector and Removals Guidance, the Science Based Targets Network freshwater and land targets, and more. Additionally, SPAM data is crucial for climate models, land use scenario models, agricultural production emissions calculations, land use change emissions calculations and yield gap analyses, which provide insights needed to achieve food security and to support sustainable livelihoods.
How was SPAM developed?
The Spatial Production Allocation Model (SPAM) was first developed by IFPRI, who released a global model and accompanying maps for 2000, 2005 and 2010, and for Sub-Saharan Africa for 2017. Partnering with Land & Carbon Lab, IFPRI has now updated the model and global map to include data and inputs from 2020.
To develop the updated map, the team at IFPRI collected statistical data about field crops and tree crops from census and survey sources such as FAOSTAT, national statistics offices, ministries of agriculture and household surveys. This data included harvested area, yield and production for 46 crops or crop groups (e.g. vegetable) circa 2020 (2019-2021 averages).
The team then applied SPAM to:
Break down the data by crop, management system (rainfed versus irrigated) and administrative level (country level versus sub-national).
Spatially distribute the physical area of cropland over grid cells based on remote sensing and crowd-sourced products (i.e. GlobeLand30 and OpenStreetMap) for suitability of the land to be cropland, including whether it was rainfed or irrigated.
Spatially allocate the data on crop areas, yields and production to create 10km maps for the physical area, harvested area, yield and production for each crop or crop group.
This latest version of SPAM includes updating the baseline to 2020 and adding information on several crops that were not included in previous versions, such as rubber. Further, for the first time, all SPAM source code and most input data are openly accessible on GitHub, aligning with Land & Carbon Lab’s commitment to open access data, which we believe is fundamental for driving innovation and collaboration. By sharing the data, code and methodology, SPAM allows users to take the statistical data and run their own spatial allocation, customizing the data to their needs and spatial resolution.
What does the data show us?
With all this data available on maps, we can see patterns both between and within countries, which can help us understand what crops are growing where, with what yields, and if they are irrigated or not. With a finite amount of land, a changing climate and growing population, this information can be critical to understanding drivers of deforestation and conversion of natural lands, crop-related emissions and water use. By showing what types of crops are being produced, SPAM provides insight into croplands’ impacts and whether and how we can meet food security needs.
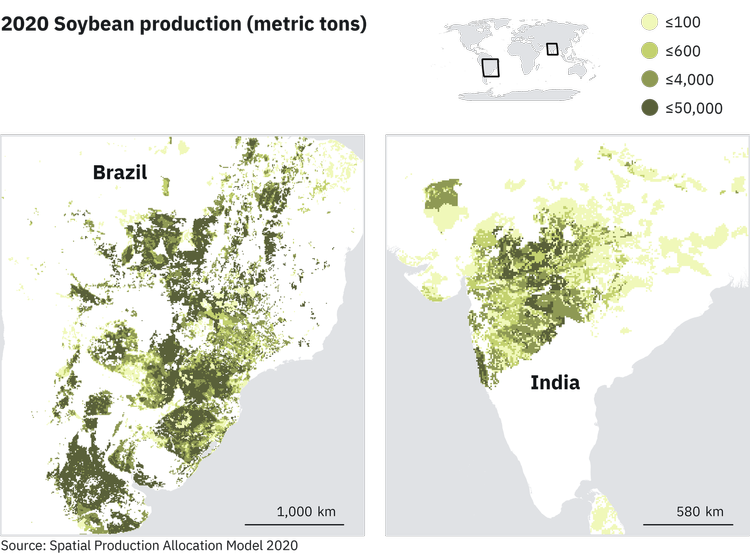
For example, looking at soy producing areas, MapSPAM makes it possible to see where crops have high versus low yields, meaning where more land is being used for less crops. In Madhya Pradesh and Maharashtra in India, where soy is largely consumed as protein or processed into oil, there is relatively high production of soy with relatively low yields.
By contrast, in Brazil, the U.S. and China, where the majority of soy is used as animal feed, yields are relatively high. However, with the MapSPAM data and additional contextual information, we can see that despite these higher yields, soy is still a major contributor to land conversion in these areas due to growing demand for livestock feed.
With MapSPAM, it's possible to see differences in crop yields within and between countries
How is MapSPAM being used to map and monitor sustainable supply chains?
As the most comprehensive spatial data set showing where specific crops are planted, companies setting goals to increase the sustainability of their supply chains have already been able to use MapSPAM to help monitor greenhouse gas emissions, water use and more, and Land & Carbon Lab is helping to ensure that these companies have access to the data they need for monitoring, verifying and reporting on their progress. Since this latest release includes data from 2020, it will be particularly useful for companies that are setting land targets with the Science Based Targets Network, which have 2020 baselines.
Improving sustainability of water use in supply chains
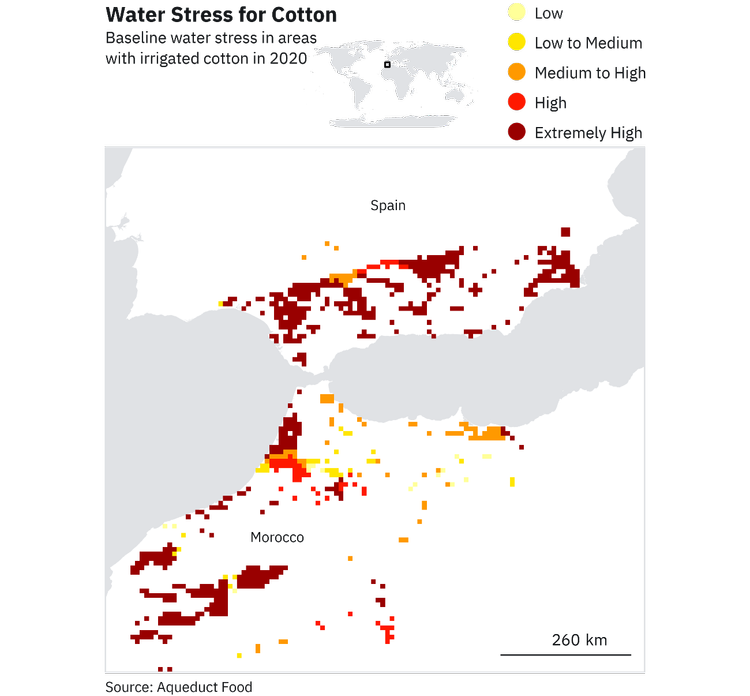
Four billion people live under high water stress conditions for at least one month per year, and agriculture is the largest consumer of freshwater. WRI’s Aqueduct Food overlays MapSPAM area data with Aqueduct water risk data, which enables companies to understand where the commodities they are sourcing from are facing or contributing to water stress, water depletion, groundwater table decline, coastal eutrophication potential, unimproved access to drinking water or unimproved access to sanitation in relation to each crop.
For example, a company buying cotton from southern Spain, where cotton is irrigated, may want to set a science based target for freshwater but only knows the state where they buy from an aggregator. Using Aqueduct Food with MapSPAM data, the company can better understand where cotton production in the area they are sourcing from overlaps with high water stress areas.
Aqueduct Food with MapSPAM data shows where crops may face or contribute to water stress
Improve understanding, monitoring and lowering emissions in supply chains
The new MapSPAM 2020 data makes big improvements for companies attempting to calculate greenhouse gas (GHG) emissions in their supply chains.
Since MapSPAM is spatially explicit and globally consistent, it allows companies without full traceability in their supply chain to use MapSPAM data to calculate statistical land use change (sLUC) to report their emissions in compliance with the GHG Protocol. Companies can use the several years of MapSPAM data to allocate land use change emissions from crop-related deforestation using methods aligned with the GHG Protocol’s Land Sector and Removals Guidance. Companies can also use MapSPAM’s physical and harvested area data to identify intensive cropping — several rotations of the same crop — and yield data in their sLUC calculations if they do not have that information available.
For this example, MapSPAM provides an improvement over non-spatial data (e.g., FAOSTAT) to calculate sLUC values at subnational levels, making it possible for companies that know the sourcing municipality or subnational region to report more accurate emission values and identify areas of concern.
At a global level, researchers at Cornell are using MapSPAM 2020 data as an input to calculate global cropland emissions. The resulting maps will provide critical information for developing more accurate GHG accounting for the agricultural sector and targeted solutions for reducing its emissions.
What’s next for MapSPAM and monitoring global crop yields?
The release of the SPAM 2020 updated model and maps makes significant progress toward mapping crops and commodities around the world, but there is still work to do in order to be able to monitor change in these crops over time. While there are multiple years of MapSPAM data sets, the data is not intended to be compared across time due to changes in the models. Land & Carbon Lab, IFPRI and the University of Minnesota are working together to create a timeseries of spatialized statistical crop data, similar to MapSPAM, annually for 2010-2020. This new data will allow us to see change over time in crop areas, yields and even what sector the crops are being used for.
Mapping what crops are being produced, where, and how much with MapSPAM is an important step toward developing sustainable supply chains and advancing food security, and future developments of this data will provide valuable tools to help sustain the world’s population while also protecting critical ecosystems. This data is another step forward in our mission to monitor all the world’s land and nature-based carbon. Already, data from Land & Carbon Lab and our partners has made it possible to monitor billions of trees outside of forests, changes to global land cover, forest carbon fluxes, and near real-time disturbances for all the world’s vegetated land — with much more to come. Explore our data here.
Explore MapSPAM here and watch a recording of our webinar to learn more about how this important mapping data is helping improve supply chain sustainability and solve the global land squeeze.